Uniform distribution
Usage
create_normal_prior(
  names = NULL,
  mean = 0,
  sd = 1,
  lower = -Inf,
  upper = Inf,
  repair = c("unique", "universal", "check_unique", "unique_quiet", "universal_quiet")
)

create_uniform_prior(
  names = NULL,
  lower = 0,
  upper = 1,
  repair = c("unique", "universal", "check_unique", "unique_quiet", "universal_quiet")
)
Arguments
- names
[character()]
Optional names for each parameter. IfNULL, default names and indices are generated.- mean, sd
[double()]
Mean and standard deviation for each marginal normal distribution.sdmust be strictly positive.- lower, upper
[double()]
Lower and upper bounds for each parameter. If used withcreate_normal_prior(), these define the truncation limits.- repair
[character(1)]
Name repair strategy fornames. One of"check_unique","unique","universal","unique_quiet", or"universal_quiet". Seevctrs::vec_as_names()for details.
Value
An ernest_prior, additionally inheriting from the specialized
class uniform_prior or normal_prior.
Details
The provided transformations are vectorized: they accept a matrix of points in the unit hypercube and return a matrix of transformed values.
See also
create_prior() for more on priors within nested sampling.
Other priors:
create_prior()
Examples
# Specify a prior with independent marginals
normal <- create_normal_prior(
names = c("beta0", "beta1", "beta2"),
mean = 0,
sd = 5
)
uniform <- create_uniform_prior(names = "sd", lower = 0, upper = 5)
composite <- normal + uniform
composite
#> composite prior distribution with 4 dimensions (beta0, beta1, beta2, and sd)
# Propose a conditional (hierarchical) prior in vectorized form
fn <- function(x) {
n <- nrow(x)
out <- matrix(NA_real_, nrow = n, ncol = 3)
# x[1] follows N(5, 1)
out[, 1] <- stats::qnorm(x[, 1], mean = 5, sd = 1)
# log10(x[2]) follows Uniform(-1, 1)
out[, 2] <- 10^stats::qunif(x[, 2], min = -1, max = 1)
# x[3] follows N(x[1], x[2])
out[, 3] <- stats::qnorm(x[, 3], mean = out[, 1], sd = out[, 2])
out
}
conditional_prior <- create_prior(
vectorized_fn = fn,
names = c("mean", "sd", "x"),
lower = c(-Inf, 0, -Inf)
)
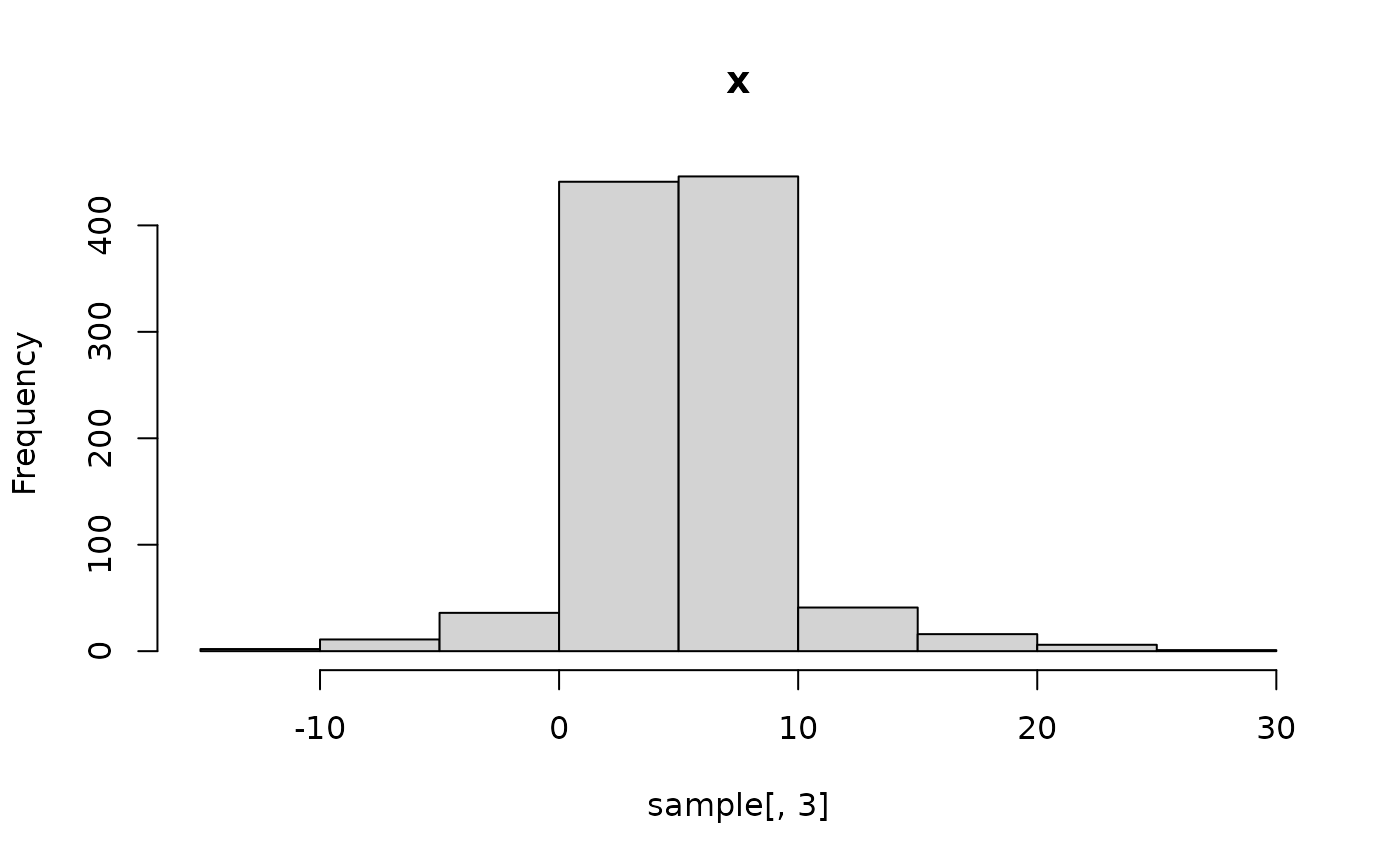
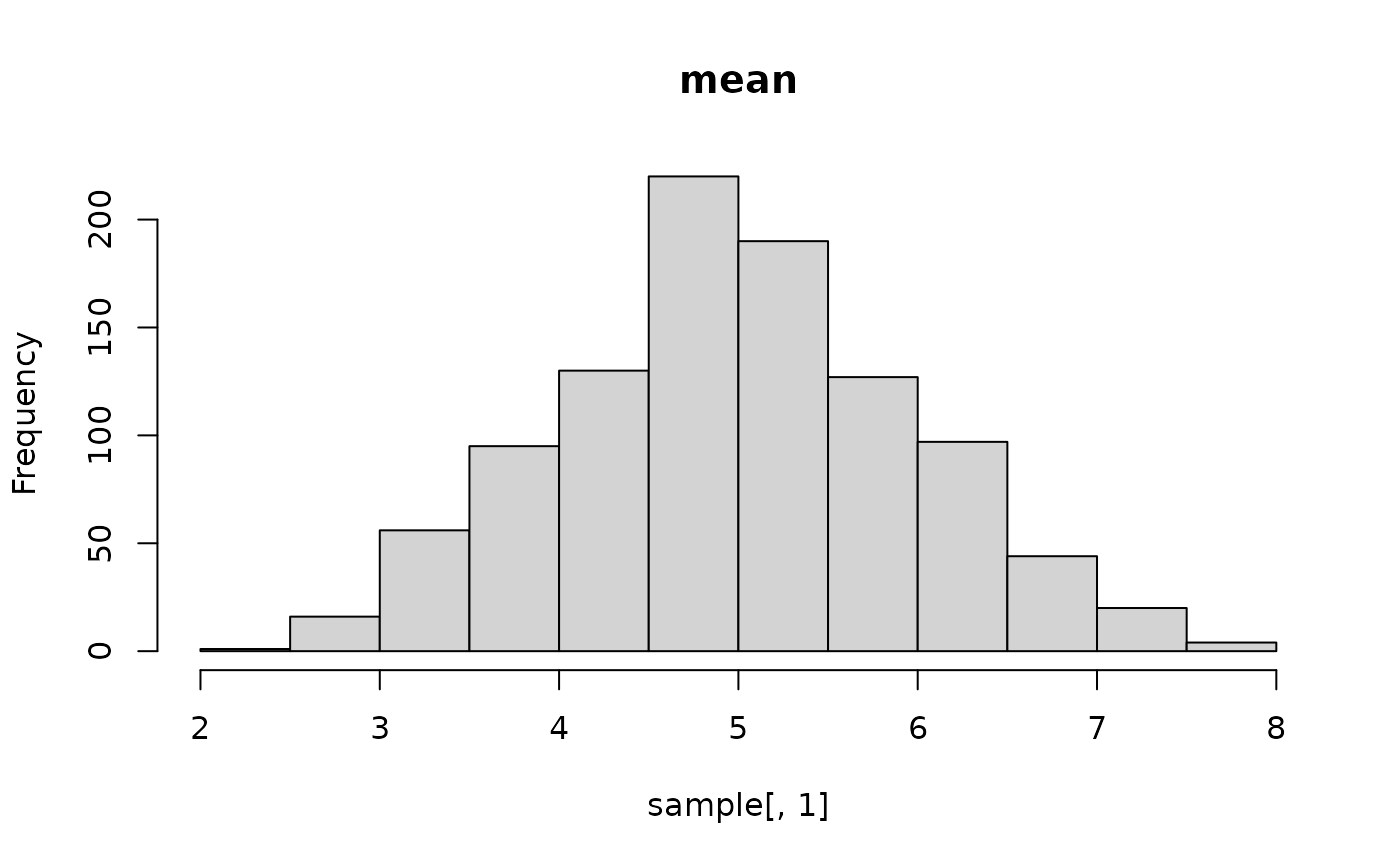
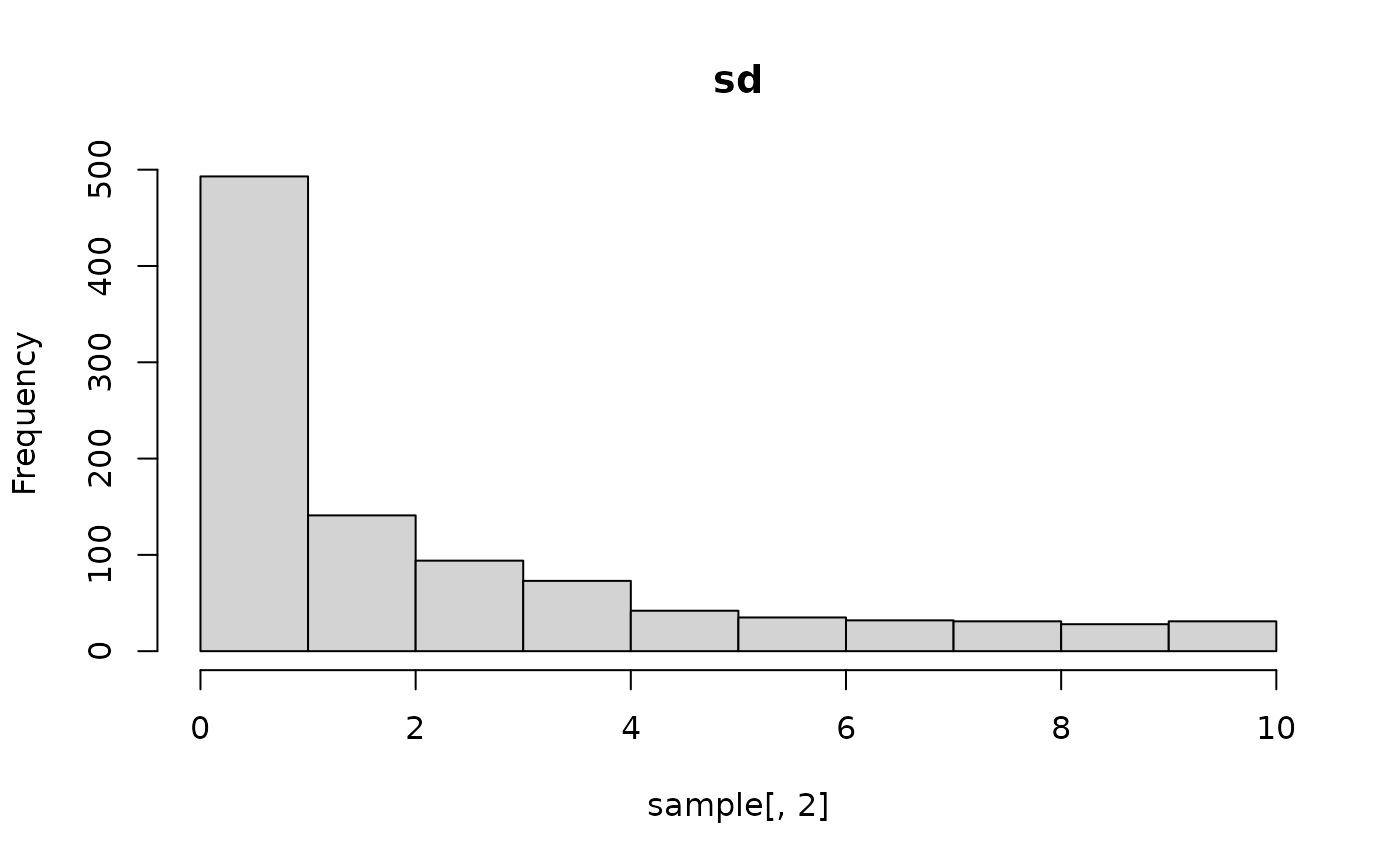
# Plot the marginals
sample <- conditional_prior$fn(matrix(runif(1000 * 3), nrow = 1000))
hist(sample[, 1], main = "mean")
 hist(sample[, 2], main = "sd")
 hist(sample[, 3], main = "x")